Note
Go to the end to download the full example code.
Surface EMG Signals#
After having created the MUAPs, we can finally simulate the surface EMG by creating a surface EMG model.
Note
The surface EMG signals are the summation of the MUAPs at the surface of the skin.
In Myogen, we can simulate the surface EMG by convolving the MUAPs with the spike trains of the motor units.
Import Libraries#
from pathlib import Path

import joblib
import numpy as np
import quantities as pq
import seaborn as sns
from matplotlib import pyplot as plt

from myogen import simulator
from myogen.utils.neo import signal_to_grid
from myogen.utils.types import CURRENT__AnalogSignal, SPIKE_TRAIN__Block

plt.style.use("fivethirtyeight")
Load Necessary Models#
save_path = Path("./results")

spike_train__Block: SPIKE_TRAIN__Block = joblib.load(save_path / "trapezoid_dd_spike_trains.pkl")
input_current__AnalogSignal: CURRENT__AnalogSignal = joblib.load(
    save_path / "trapezoid_drive_pattern.pkl"
)
surface_emg: simulator.SurfaceEMG = joblib.load(save_path / "surface_emg.pkl")
Generate Surface EMG#
To simulate the surface EMG, we need to run the simulate_surface_emg method of the SurfaceEMG object.
surface_emg_signals = surface_emg.simulate_surface_emg(spike_train__Block=spike_train__Block)

print("Surface EMG simulation completed!")
# Access the first group (electrode array) and first segment (pool)
first_emg_signal = surface_emg_signals.groups[0].segments[0].analogsignals[0]
grid_shape = first_emg_signal.annotations["grid_shape"]
print(f"Generated EMG shape: {first_emg_signal.shape} (stored as 2D for NWB compatibility)")
print(f"  - {first_emg_signal.shape[0]} time samples")
print(f"  - {grid_shape[0]} electrode rows")
print(f"  - {grid_shape[1]} electrode columns")

# Save the surface EMG results
joblib.dump(surface_emg_signals, save_path / "surface_emg_signals.pkl")
Electrode Array 1/1 Surface EMG (CPU):   0%|          | 0/1 [00:00<?, ?pools/s]
Electrode Array 1/1 Surface EMG (CPU): 100%|██████████| 1/1 [00:00<00:00,  2.49pools/s]
Electrode Array 1/1 Surface EMG (CPU): 100%|██████████| 1/1 [00:00<00:00,  2.49pools/s]
Surface EMG simulation completed!
Generated EMG shape: (30720, 25) (stored as 2D for NWB compatibility)
  - 30720 time samples
  - 5 electrode rows
  - 5 electrode columns

['results/surface_emg_signals.pkl']
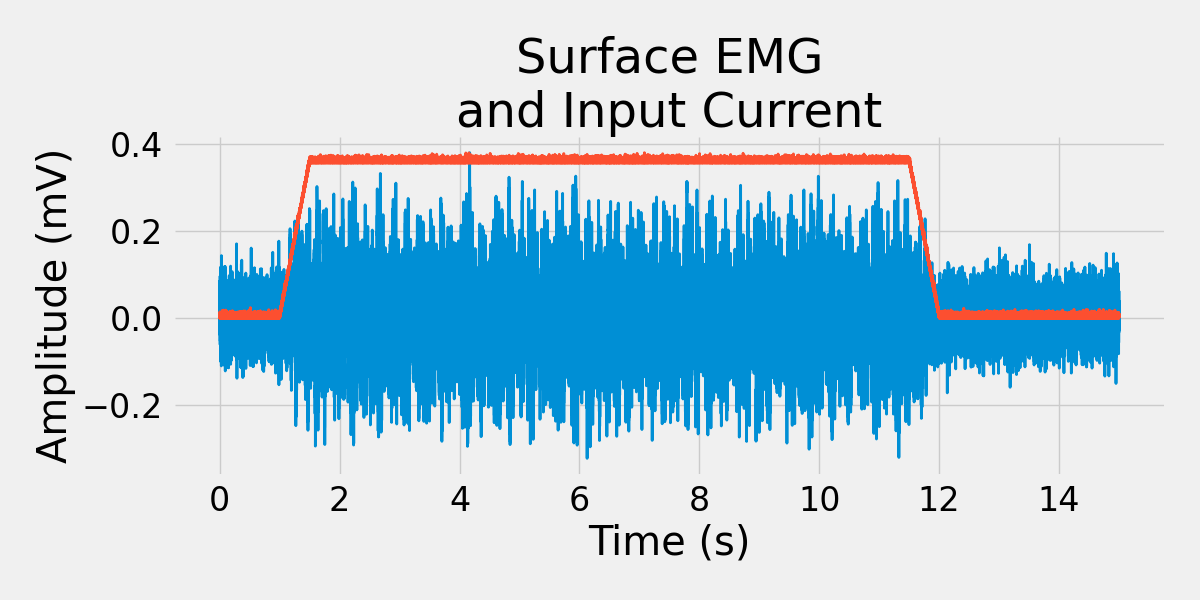
Visualize Surface EMG Results#
Note
Since MyoGen is a simulator, the results will have no real-world noise.
We can add noise to the surface EMG signals to make them more realistic.
For this the method add_noise is used.
noisy_surface_emg__Block = surface_emg.add_noise(snr__dB=5.0)

# Load input current as AnalogSignal

plt.rcParams.update({"font.size": 24})
# Create single plot with normalized signals
fig, ax = plt.subplots(figsize=(12, 6))

# Get EMG signal from noisy surface EMG (first pool, electrode at row 2, col 2)
noisy_signal = noisy_surface_emg__Block.groups[0].segments[0].analogsignals[0]
emg_grid = signal_to_grid(noisy_signal)  # Convert to 3D (time, rows, cols)
emg_signal = emg_grid[:, 2, 2]
current_signal = input_current__AnalogSignal[:, 0].magnitude

# Normalize current between 0 and 1
current_normalized = (current_signal - np.min(current_signal)) / (
    np.max(current_signal) - np.min(current_signal)
)

current_normalized *= np.max(emg_signal)  # Scale to match EMG amplitude range

# Plot both normalized signals on same axis
ax.plot(
    np.arange(len(emg_signal)) / surface_emg.sampling_frequency__Hz,
    emg_signal,
    linewidth=2,
    label="Surface EMG",
)

ax.plot(
    input_current__AnalogSignal.times.rescale(pq.s).magnitude,
    current_normalized,
    linewidth=2,
    label="Input Current",
    alpha=1,
    zorder=4,
)

ax.set_xlabel("Time (s)")
ax.set_ylabel("Amplitude (mV)")

sns.despine(trim=True, left=False, bottom=False, right=True, top=True, offset=5)

plt.title("Surface EMG\nand Input Current")

plt.tight_layout()
plt.show()
Total running time of the script: (0 minutes 0.777 seconds)