Note
Go to the end to download the full example code.
Recruitment Thresholds#
The first step in using MyoGen is to generate the recruitment thresholds of the motor units (MUs).
Note
A recruitment threshold is the minimum force required to activate a MU.
In MyoGen, the threshold is defined between 0 and 1, where 0 is the minimum force required to activate a MU and 1 is the maximum force required to activate a MU.
MyoGen offers 4 different models to generate the recruitment thresholds:
Fuglevand model: Classic exponential distribution (Fuglevand et al., 1993)
De Luca model: Slope-corrected exponential distribution (De Luca & Contessa, 2012)
Konstantin model: Exponential with explicit maximum threshold control (Konstantin et al., 2020)
Combined model: Hybrid approach combining De Luca shape with Konstantin scaling (Ours)
Import Libraries#
from pathlib import Path

import joblib
from matplotlib import pyplot as plt
from myogen import simulator

plt.style.use("fivethirtyeight")
Define Common Parameters#
Each recruitment threshold simulation is defined by the following parameters:
N: Number of motor units in the poolrecruitment_range: Recruitment range (max_threshold / min_threshold)
Note
The recruitment_range is defined as the ratio between the maximum and minimum recruitment thresholds.
For example, if the recruitment_range is 50, the biggest MU will have a recruitment threshold 50 times bigger than the smallest MU.
n_motor_units = 100  # Number of motor units in the pool
recruitment_range = 100  # Recruitment range (max_threshold / min_threshold)

# Create results directory
save_path = Path("./results")
save_path.mkdir(exist_ok=True)
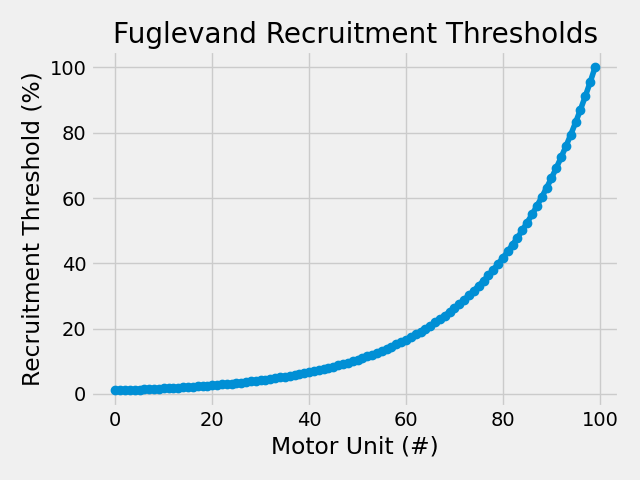
Fuglevand Model#
The Fuglevand model uses a simple exponential distribution for recruitment thresholds. This is the classic approach from Fuglevand et al. (1993).
No additional parameters needed - only requires the common parameters.
Important
MyoGen is intended to be used with the following API:
from myogen import simulator
rt_fuglevand, _ = simulator.RecruitmentThresholds(
    N=n_motor_units, recruitment_range__ratio=recruitment_range, mode="fuglevand"
)

plt.plot(rt_fuglevand * 100, "-o", label="Fuglevand Model")
plt.title("Fuglevand Recruitment Thresholds")
plt.xlabel("Motor Unit (#)")
plt.ylabel("Recruitment Threshold (%)")
plt.tight_layout()
plt.show()
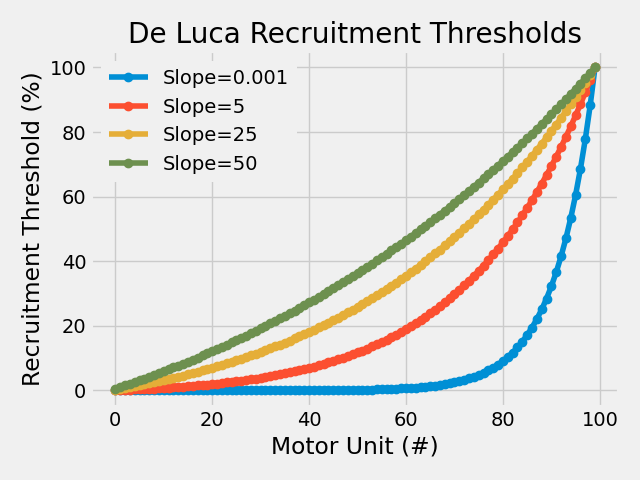
De Luca Model#
The De Luca model includes a slope correction parameter that allows control over the shape of the recruitment threshold distribution.
Additional parameter:
deluca__slope: Controls the shape of the distribution
deluca_results = {
    slope: simulator.RecruitmentThresholds(
        N=n_motor_units,
        recruitment_range__ratio=recruitment_range,
        deluca__slope=slope,
        mode="deluca",
    )[0]
    for slope in [0.001, 5, 25, 50]
}

for s, rt in deluca_results.items():
    plt.plot(rt * 100, "-o", label=f"Slope={s}")
plt.title("De Luca Recruitment Thresholds")
plt.xlabel("Motor Unit (#)")
plt.ylabel("Recruitment Threshold (%)")
plt.legend(framealpha=1.0, edgecolor="none")
plt.tight_layout()
plt.show()
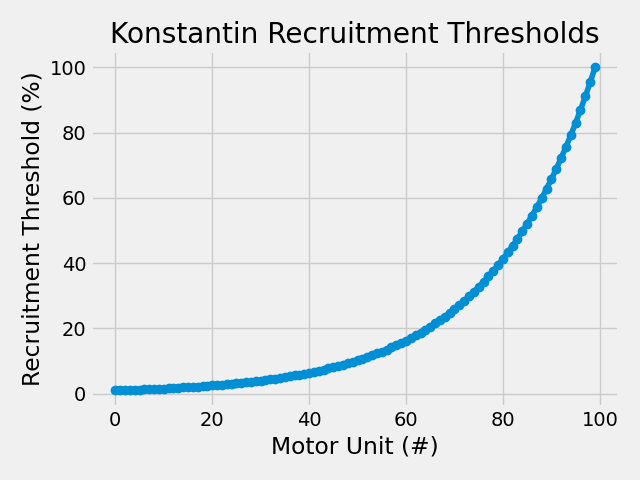
Konstantin Model#
The Konstantin model provides explicit control over the maximum recruitment threshold while maintaining physiological recruitment patterns.
Additional parameter:
konstantin__max_threshold: Maximum recruitment threshold
rt_konstantin, _ = simulator.RecruitmentThresholds(
    N=n_motor_units,
    recruitment_range__ratio=recruitment_range,
    konstantin__max_threshold__ratio=1.0,
    mode="konstantin",
)

plt.plot(rt_konstantin * 100, "-o", label="Konstantin Model")
plt.title("Konstantin Recruitment Thresholds")
plt.xlabel("Motor Unit (#)")
plt.ylabel("Recruitment Threshold (%)")
plt.tight_layout()
plt.show()
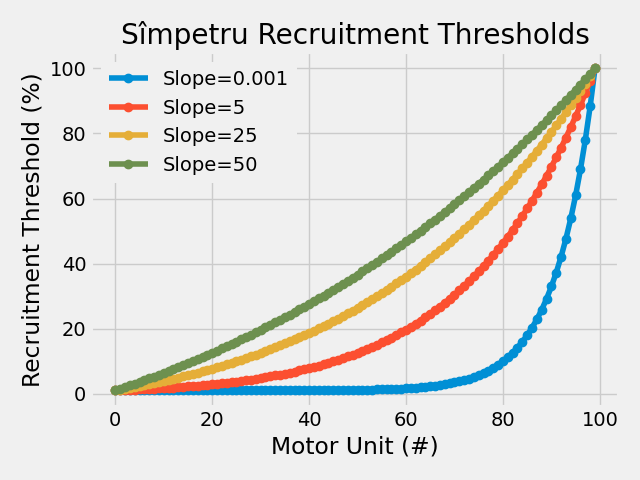
Combined Model#
The Combined model merges De Luca’s shape control with Konstantin’s scaling, offering the most flexibility for custom recruitment patterns.
Additional parameters:
deluca__slope: Controls the shape of the distributionkonstantin__max_threshold: Maximum recruitment threshold # Slopes for combined model
combined_results = {
    slope: simulator.RecruitmentThresholds(
        N=n_motor_units,
        recruitment_range__ratio=recruitment_range,
        deluca__slope=slope,
        konstantin__max_threshold__ratio=1.0,
        mode="combined",
    )[0]
    for slope in [0.001, 5, 25, 50]
}

for s, rt in combined_results.items():
    plt.plot(rt * 100, "-o", label=f"Slope={s}")
plt.title("Combined Recruitment Thresholds")
plt.xlabel("Motor Unit (#)")
plt.ylabel("Recruitment Threshold (%)")
plt.legend(framealpha=1.0, edgecolor="none")
plt.tight_layout()
plt.show()
Save Recruitment Thresholds#
Note
All MyoGen objects can be saved to a file using joblib. This is useful to avoid re-running expensive simulations if you need to use the same parameters.
joblib.dump(combined_results[5], save_path / "thresholds.pkl")
['results/thresholds.pkl']
Total running time of the script: (0 minutes 0.448 seconds)