Note
Click here to download the full example code
Force Generation
After generating spike trains from motor neuron pools, the next step is to simulate the force output produced by the muscle. MyoGen provides a comprehensive force model based on the classic Fuglevand et al. (1993) approach.
Note
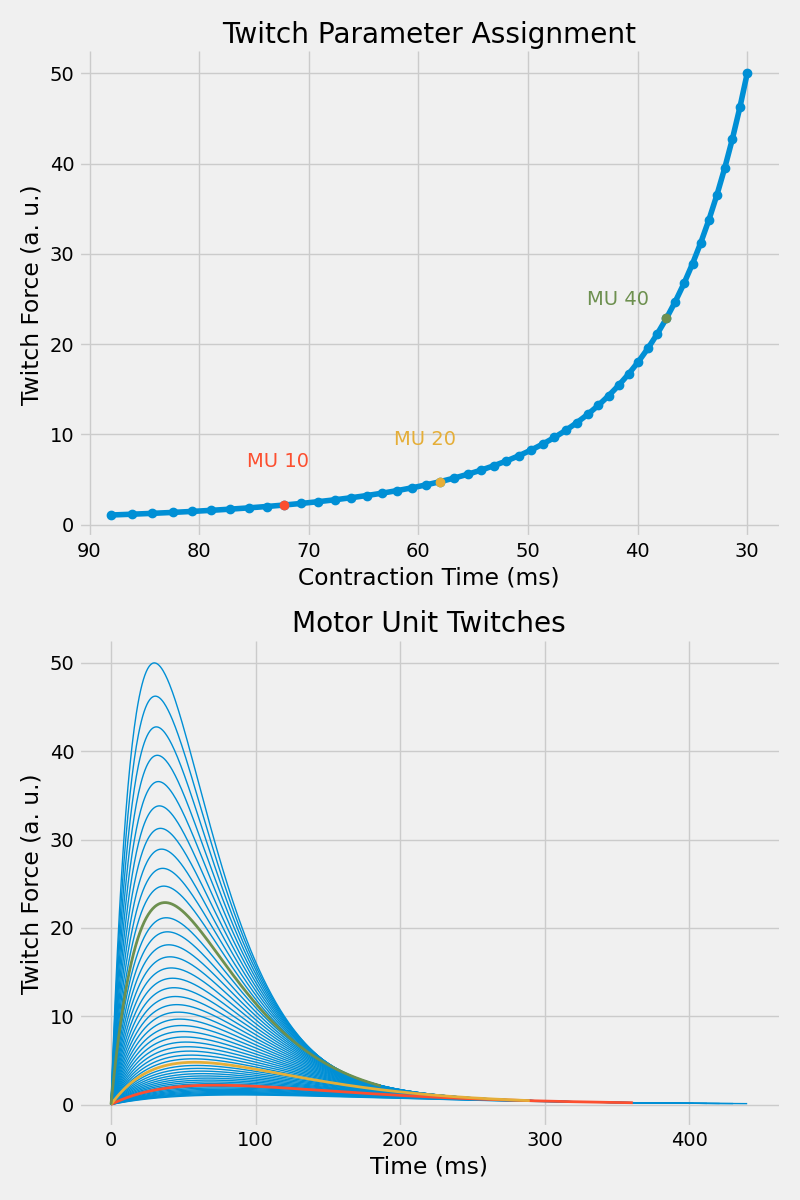
The force model converts spike trains into force by simulating individual motor unit twitches and their summation. Each motor unit has unique twitch characteristics (amplitude, duration) that depend on its recruitment threshold.
The force model includes:
- Motor unit twitch characteristics: Peak force and contraction time based on recruitment thresholds
- Nonlinear gain modulation: Force scaling based on inter-pulse intervals (discharge rate)
- Temporal summation: Realistic force buildup from overlapping twitches
- Physiological scaling: Realistic force ranges and dynamics
References
[1] Fuglevand, A. J., Winter, D. A., & Patla, A. E. (1993). Models of recruitment and rate coding organization in motor-unit pools. J Neurophysiol, 70(6), 2470–2488. https://doi.org/10.1152/jn.1993.70.6.2470.
Import Libraries
from pathlib import Path

import joblib
import matplotlib.pyplot as plt
import numpy as np

from myogen import load_profile
from myogen.utils.plotting.force import plot_twitch_parameter_assignment, plot_twitches

plt.style.use("fivethirtyeight")
Create Force Model
The ForceModel calculates each motor unit's twitch (peak force and contraction
time) from its recruitment threshold. Its main parameters are:
recruitment_thresholds: Motor unit recruitment thresholdsrecording_frequency__Hz: Sampling frequency of the forceforce_frequency_shape: Shape of the force-frequency (gain) curve
The fdi_semg profile card builds it with the thresholds and the human force-frequency curve
(Macefield 1996, Fuglevand 1999) the FDI drive was calibrated with.
load_profile("fdi_semg.published").force_model() uses the curve of Fuglevand 1993 instead.
card = load_profile()  # fdi_semg
force_model = card.force_model()

# Display force model statistics
print("Force model statistics:")
print(f"\tNumber of motor units: {force_model._number_of_neurons}")
print(f"\tRecruitment ratio: {force_model._recruitment_ratio:.1f}")
print(
    f"\tPeak force range: {force_model.peak_twitch_forces__unitless[0]:.3f} - {force_model.peak_twitch_forces__unitless[-1]:.3f}"
)
print(
    f"\tContraction time range: {force_model.contraction_times__samples[0]:.1f} - {force_model.contraction_times__samples[-1]:.1f} samples"
)
Out:
Force model statistics:
        Number of motor units: 120
        Recruitment ratio: 48.4
        Peak force range: 1.033 - 48.396
        Contraction time range: 182.6 - 61.4 samples
Visualize Twitch Parameter Assignment
The force model assigns twitch parameters (peak force and contraction time) to each motor unit based on its recruitment threshold. Let's visualize this relationship for a subset of motor units.
plt.figure(figsize=(8, 12))

ax1 = plt.subplot(2, 1, 1)
plot_twitch_parameter_assignment(
    force_model, ax1, [10, 20, 40], flip_x=True, apply_default_formatting=True
)
ax1.set_title("Twitch Parameter Assignment")

ax2 = plt.subplot(2, 1, 2)
plot_twitches(force_model, ax2, [10, 20, 40], apply_default_formatting=True)
ax2.set_title("Motor Unit Twitches")

plt.tight_layout()
plt.show()
Load Spike Trains
The spike trains of the 25 % MVC contraction from example 03 (calibrated FDI drive).
save_path = Path("./results")
spike_train__Block = joblib.load(save_path / "trapezoid_dd_spike_trains.pkl")
Generate Force Output
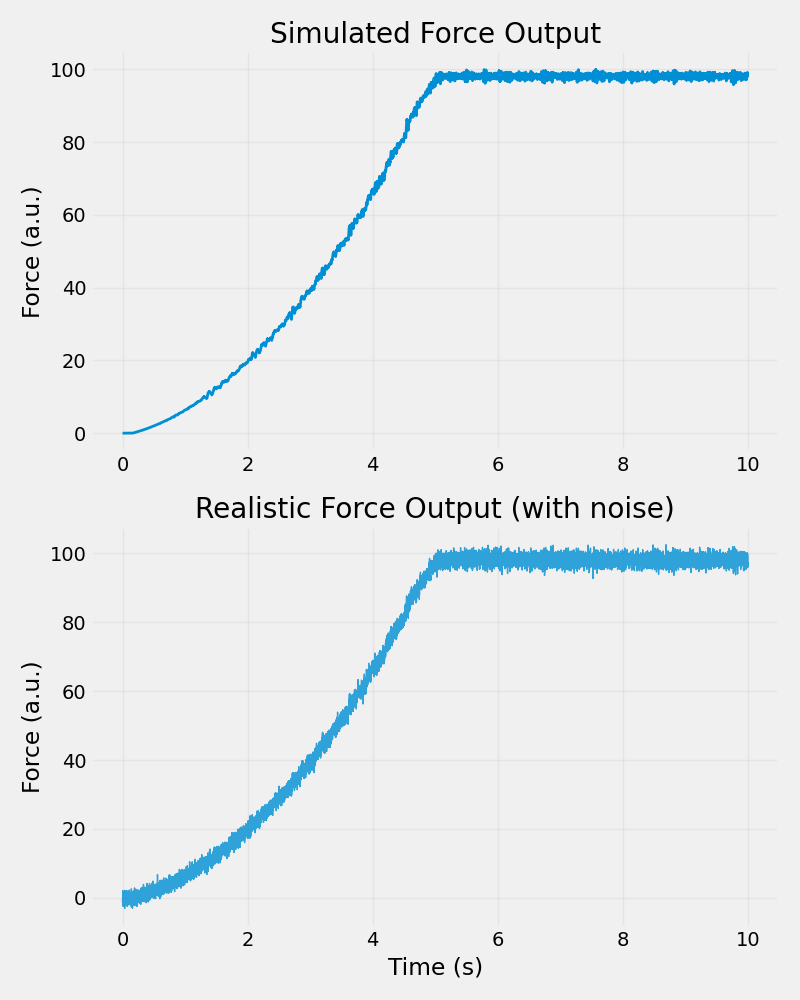
Now we can use the force model to convert the spike trains into force output. The model will simulate individual motor unit twitches and their temporal summation to produce the total muscle force.
# Generate force from spike trains, and express it in % MVC with the card's MVC (from its MVC ramp)
force_output = force_model.generate_force(spike_train__Block=spike_train__Block)
force_pct_mvc = 100.0 * force_output.magnitude[:, 0] / card.value("drive.mvc_model_units")

# Add some realistic noise to the force signal
noise_level = 0.015  # 0.15% of mean force
noisy_force = force_output.magnitude[:, 0] + np.random.randn(
    len(force_output.magnitude[:, 0])
) * noise_level * np.mean(force_output.magnitude[:, 0])
Visualize Force Output
Let's plot the generated force alongside the input current to see how the muscle responds to the electrical stimulation.
plt.figure(figsize=(8, 10))

ax1 = plt.subplot(2, 1, 1)

ax1.plot(
    force_output.times.rescale("s"),
    force_pct_mvc,
    linewidth=2,
    label="Clean Force",
)

ax1.set_ylabel("Force (% MVC)")
ax1.set_title("Simulated Force Output")
ax1.grid(True, alpha=0.3)

# Plot noisy force (more realistic)
ax2 = plt.subplot(2, 1, 2)
ax2.plot(
    force_output.times.rescale("s"),
    noisy_force,
    linewidth=1,
    alpha=0.8,
    label="Noisy Force",
)

ax2.set_xlabel("Time (s)")
ax2.set_ylabel("Force (a.u.)")
ax2.set_title("Realistic Force Output (with noise)")
ax2.grid(True, alpha=0.3)

plt.tight_layout()
plt.show()
Total running time of the script: ( 0 minutes 0.451 seconds)