Note
Click here to download the full example code
Recruitment Thresholds
The first step in using MyoGen is to generate the recruitment thresholds of the motor units (MUs).
Note
A recruitment threshold is the minimum force required to activate a MU.
In MyoGen, the threshold is defined between 0 and 1, where 0 is the minimum force required to activate a MU and 1 is the maximum force required to activate a MU.
MyoGen offers 4 different models to generate the recruitment thresholds:
- Fuglevand model: Classic exponential distribution (Fuglevand et al., 1993)
- De Luca model: Slope-corrected exponential distribution (De Luca & Contessa, 2012)
- Konstantin model: Exponential with explicit maximum threshold control (Konstantin et al., 2020)
- Combined model: Hybrid approach combining De Luca shape with Konstantin scaling (Ours)
Import Libraries
from pathlib import Path

import joblib
from matplotlib import pyplot as plt
from myogen import simulator

plt.style.use("fivethirtyeight")
Define Common Parameters
Each recruitment threshold simulation is defined by the following parameters:
N: Number of motor units in the poolrecruitment_range: Recruitment range (max_threshold / min_threshold)
Note
The recruitment_range is defined as the ratio between the maximum and minimum recruitment thresholds.
For example, if the recruitment_range is 50, the biggest MU will have a recruitment threshold 50 times bigger than the smallest MU.
n_motor_units = 100  # Number of motor units in the pool
recruitment_range = 100  # Recruitment range (max_threshold / min_threshold)

# Create results directory
save_path = Path("./results")
save_path.mkdir(exist_ok=True)
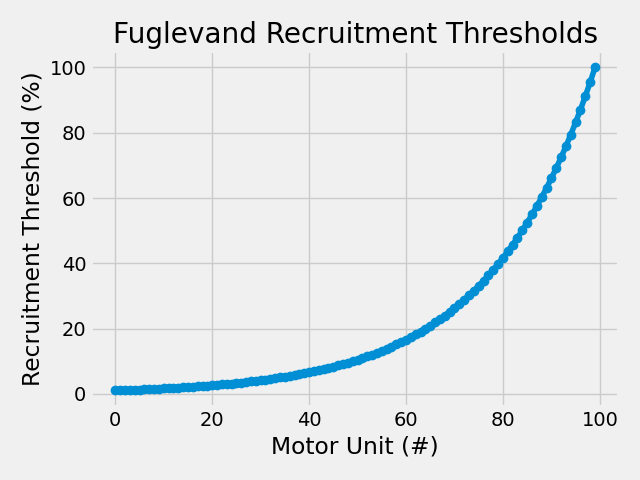
Fuglevand Model
The Fuglevand model uses a simple exponential distribution for recruitment thresholds. This is the classic approach from Fuglevand et al. (1993).
No additional parameters needed - only requires the common parameters.
rt_fuglevand, _ = simulator.RecruitmentThresholds(
    N=n_motor_units, recruitment_range__ratio=recruitment_range, mode="fuglevand"
)

plt.plot(rt_fuglevand * 100, "-o", label="Fuglevand Model")
plt.title("Fuglevand Recruitment Thresholds")
plt.xlabel("Motor Unit (#)")
plt.ylabel("Recruitment Threshold (%)")
plt.tight_layout()
plt.show()
De Luca Model
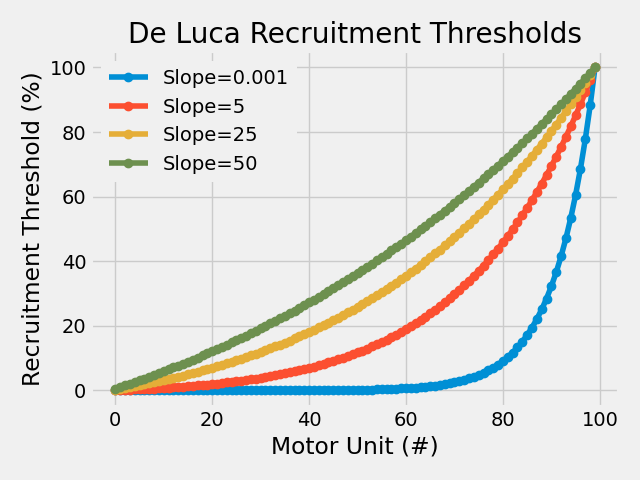
The De Luca model includes a slope correction parameter that allows control over the shape of the recruitment threshold distribution.
Additional parameter:
deluca__slope: Controls the shape of the distribution
deluca_results = {
    slope: simulator.RecruitmentThresholds(
        N=n_motor_units,
        recruitment_range__ratio=recruitment_range,
        deluca__slope=slope,
        mode="deluca",
    )[0]
    for slope in [0.001, 5, 25, 50]
}

for s, rt in deluca_results.items():
    plt.plot(rt * 100, "-o", label=f"Slope={s}")
plt.title("De Luca Recruitment Thresholds")
plt.xlabel("Motor Unit (#)")
plt.ylabel("Recruitment Threshold (%)")
plt.legend(framealpha=1.0, edgecolor="none")
plt.tight_layout()
plt.show()
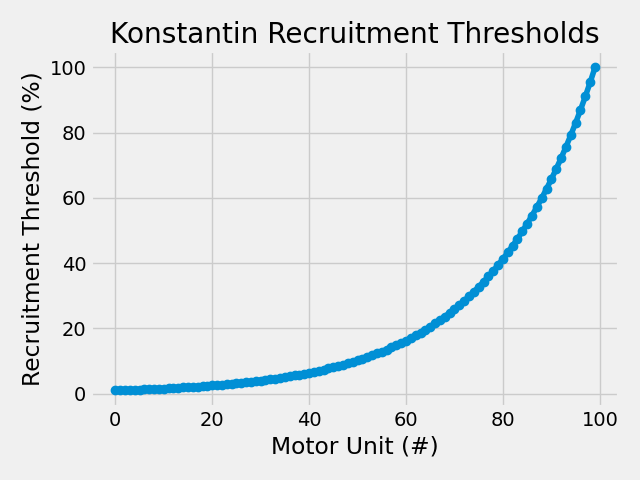
Konstantin Model
The Konstantin model provides explicit control over the maximum recruitment threshold while maintaining physiological recruitment patterns.
Additional parameter:
konstantin__max_threshold: Maximum recruitment threshold
rt_konstantin, _ = simulator.RecruitmentThresholds(
    N=n_motor_units,
    recruitment_range__ratio=recruitment_range,
    konstantin__max_threshold__ratio=1.0,
    mode="konstantin",
)

plt.plot(rt_konstantin * 100, "-o", label="Konstantin Model")
plt.title("Konstantin Recruitment Thresholds")
plt.xlabel("Motor Unit (#)")
plt.ylabel("Recruitment Threshold (%)")
plt.tight_layout()
plt.show()
Combined Model
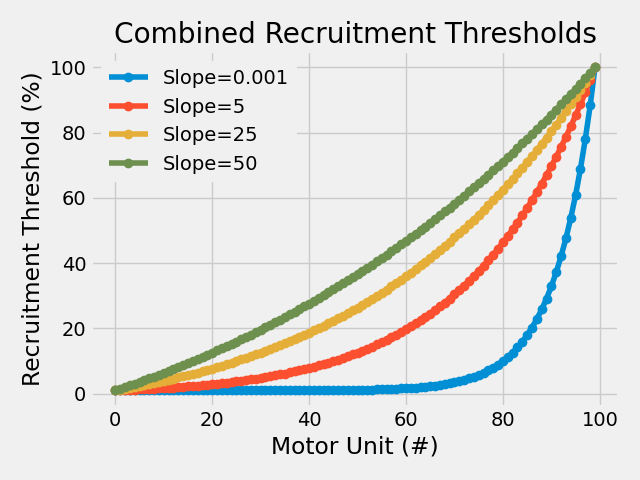
The Combined model merges De Luca's shape control with Konstantin's scaling, offering the most flexibility for custom recruitment patterns.
Additional parameters:
deluca__slope: Controls the shape of the distributionkonstantin__max_threshold: Maximum recruitment threshold # Slopes for combined model
combined_results = {
    slope: simulator.RecruitmentThresholds(
        N=n_motor_units,
        recruitment_range__ratio=recruitment_range,
        deluca__slope=slope,
        konstantin__max_threshold__ratio=1.0,
        mode="combined",
    )[0]
    for slope in [0.001, 5, 25, 50]
}

for s, rt in combined_results.items():
    plt.plot(rt * 100, "-o", label=f"Slope={s}")
plt.title("Combined Recruitment Thresholds")
plt.xlabel("Motor Unit (#)")
plt.ylabel("Recruitment Threshold (%)")
plt.legend(framealpha=1.0, edgecolor="none")
plt.tight_layout()
plt.show()
Save Recruitment Thresholds ^^^^^^^^^^^^^^^^^^^^^^^^^^^^
Note
All MyoGen objects can be saved to a file using joblib. This is useful to avoid re-running expensive simulations if you need to use the same parameters.
Out:
Total running time of the script: ( 0 minutes 0.976 seconds)
Download Python source code: 01_simulate_recruitment_thresholds.py