Note
Click here to download the full example code
Surface Motor Unit Action Potentials
After having created the muscle model, we can simulate the surface EMG by creating a surface EMG model.
First step is to create MUAPs from the muscle model.
from pathlib import Path

import joblib
import matplotlib.pyplot as plt
import numpy as np
import quantities as pq

from myogen import load_profile, simulator
from myogen.utils.neo import signal_to_grid

plt.style.use("fivethirtyeight")
Define Parameters
The surface EMG is created using the SurfaceEMG object.
The SurfaceEMG object takes the following parameters:
muscle_model: Muscle modelsampling_frequency: Sampling frequencyelectrode_grid_dimensions: Electrode grid dimensionsinter_electrode_distance: Inter-electrode distancefat_thickness: Fat thicknessskin_thickness: Skin thickness
Load Muscle Model
Load muscle model from previous example
save_path = Path("./results")
muscle: simulator.Muscle = joblib.load(save_path / "muscle_model.pkl")
Create Surface EMG Model
The SurfaceEMG object is initialized with the muscle model, the SurfaceElectrodeArray, and the simulation parameters.
Note
For simplicity, we only simulate the first motor unit.
This can be changed by modifying the MUs_to_simulate parameter.
This is to simulate the surface EMG from two different directions.
electrode_array_monopolar = simulator.SurfaceElectrodeArray(
    num_rows=5,
    num_cols=5,
    inter_electrode_distance__mm=5 * pq.mm,
    electrode_radius__mm=5 * pq.mm,
    differentiation_mode="monopolar",
    bending_radius__mm=muscle.radius__mm + muscle.skin_thickness__mm + muscle.fat_thickness__mm,
)

# The ``fdi_semg`` card sets the volume conductor and action-potential settings it was validated with (fibre
# dispersion, Rosenfalck lambda 0.63 fitted to Botelho 2019, 200 mm IAP kernel); the electrodes, the sampling rate
# and the units to simulate are yours.
card = load_profile()  # fdi_semg
surface_emg = card.surface_emg(
    muscle,
    [electrode_array_monopolar],
    sampling_frequency__Hz=sampling_frequency,
    sampling_points_in_t_and_z_domains=256,
    sampling_points_in_theta_domain=32,
    MUs_to_simulate=[0, 1, 2, 3],  # Simulate MUs 0, 1, 2, and 3
)
Simulate MUAPs
To generate the MUAPs, we need to run the simulate_muaps method of the SurfaceEMG object.
# Run simulation with progress output
muaps = surface_emg.simulate_muaps()


print("MUAP simulation completed!")
first_signal = muaps.groups[0].segments[0].analogsignals[0]
grid_shape = first_signal.annotations["grid_shape"]
print(f"Generated MUAPs shape: {first_signal.shape} (stored as 2D for NWB compatibility)")
print(f"  - {len(muaps.groups[0].segments)} total motor units in muscle")
print(f"  - {len(muscle.resulting_number_of_innervated_fibers)} MUs in muscle model")
print(f"  - {grid_shape[0]} rows × {grid_shape[1]} columns electrode grid")
print(f"  - {first_signal.shape[0]} time samples")

# Check fiber counts for the MUs we're simulating
print("\nFiber counts for simulated MUs:")
for mu_idx in range(95, min(100, len(muscle.resulting_number_of_innervated_fibers))):
    n_fibers = muscle.resulting_number_of_innervated_fibers[mu_idx]
    print(f"  MU {mu_idx}: {n_fibers} fibers")

# Save results
joblib.dump(surface_emg, save_path / "surface_emg.pkl")
Out:
/home/runner/work/MyoGen/MyoGen/myogen/simulator/core/emg/surface/volume_conductor.py:41: RuntimeWarning: divide by zero encountered in log
  result = np.where(In_s > 0, np.log(In_s) + np.abs(x), -np.inf)
/home/runner/work/MyoGen/MyoGen/myogen/simulator/core/emg/surface/volume_conductor.py:234: RuntimeWarning: invalid value encountered in subtract
  A_mat[..., 1, 0] = sig_bone * np.exp(log_In_tilde_a - log_In_a)
/home/runner/work/MyoGen/MyoGen/myogen/simulator/core/emg/surface/volume_conductor.py:234: RuntimeWarning: invalid value encountered in multiply
  A_mat[..., 1, 0] = sig_bone * np.exp(log_In_tilde_a - log_In_a)
/home/runner/work/MyoGen/MyoGen/myogen/simulator/core/emg/surface/volume_conductor.py:236: RuntimeWarning: invalid value encountered in subtract
  A_mat[..., 1, 2] = sig_muscle_geo * np.exp(log_Kn_tilde_am - log_Kn_am)
MUAP simulation completed!
Generated MUAPs shape: (256, 25) (stored as 2D for NWB compatibility)
  - 120 total motor units in muscle
  - 120 MUs in muscle model
  - 5 rows × 5 columns electrode grid
  - 256 time samples

Fiber counts for simulated MUs:
  MU 95: 641 fibers
  MU 96: 650 fibers
  MU 97: 605 fibers
  MU 98: 686 fibers
  MU 99: 713 fibers

['results/surface_emg.pkl']
Plot MUAPs
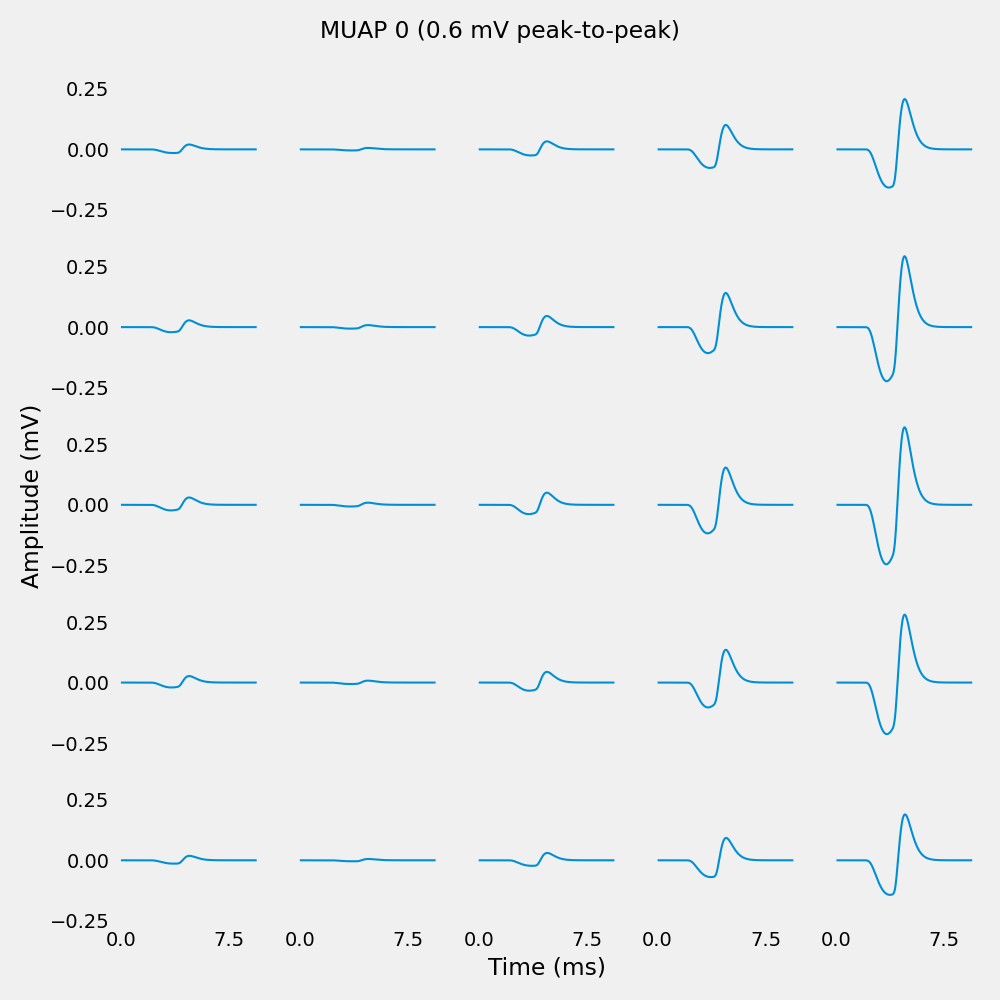
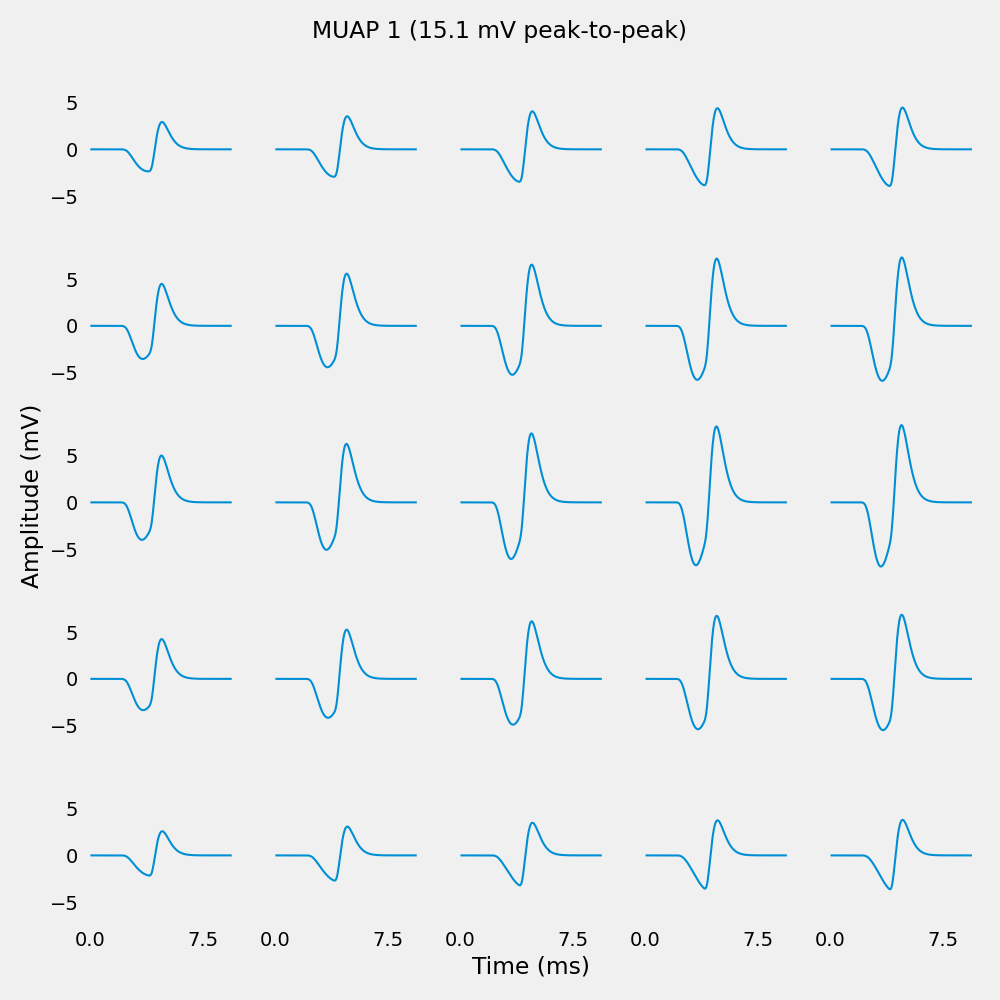
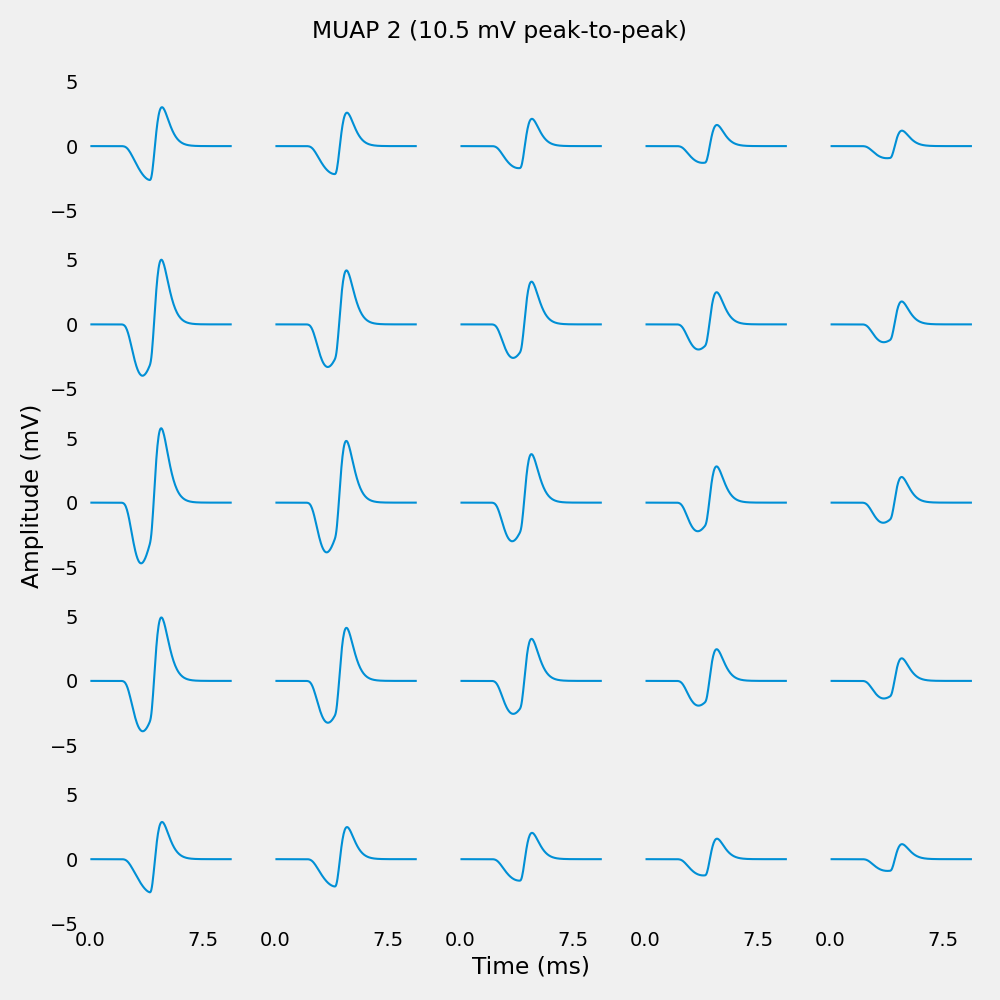
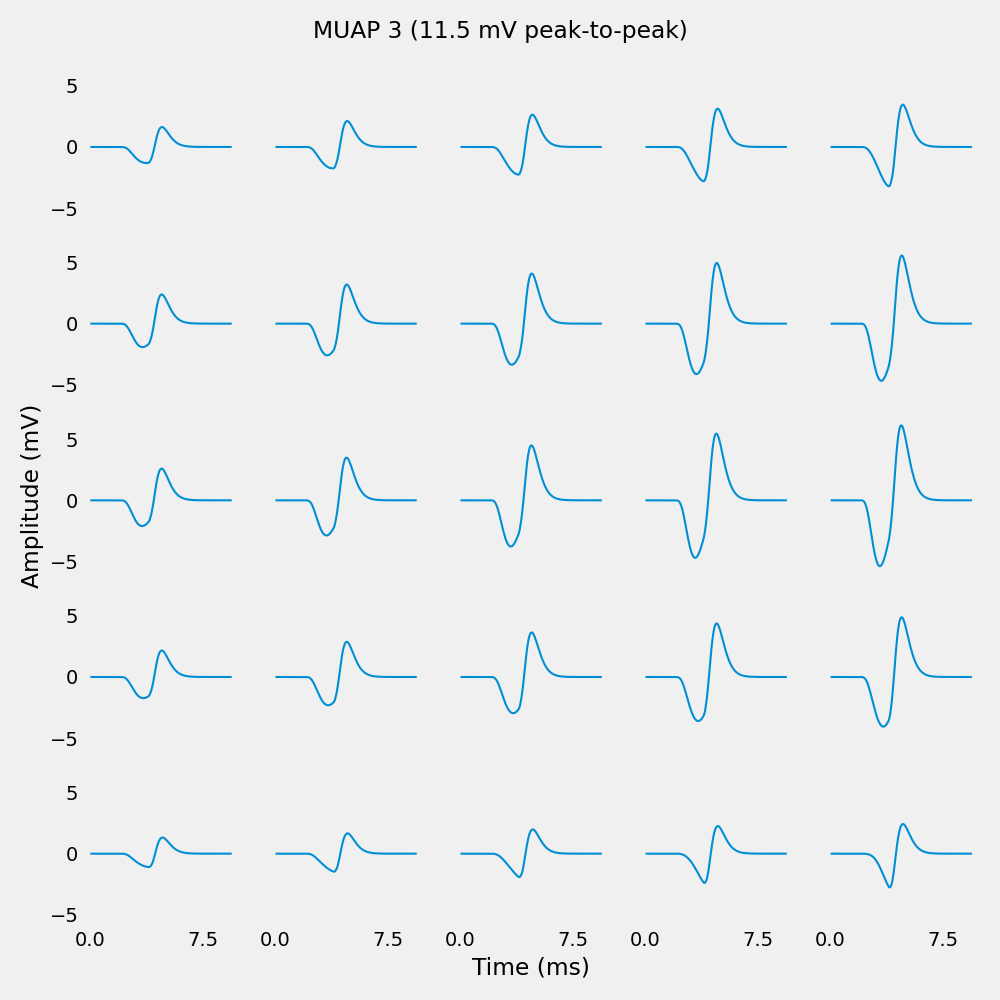
Plot a single MUAP across the electrode grid. Each subplot shows the MUAP waveform at one electrode position.
# Select which MUAP to plot
for muap_index in range(len(muaps.groups[0].segments)):
    if np.mean(muaps.groups[0].segments[muap_index].analogsignals[0]) == 0:
        continue
    # Extract MUAP data from the Block object
    muap_signal = muaps.groups[0].segments[muap_index].analogsignals[0]
    # Convert to 3D grid format (time, rows, cols)
    muap_data_mV = signal_to_grid(muap_signal)
    muap_data_uV = signal_to_grid(muap_signal.rescale(pq.uV))  # Convert to uV for plotting

    # Print amplitude diagnostics
    print(f"\nMUAP {muap_index} amplitude range:")
    print(f"\tMin: {np.min(muap_data_mV):.6f} mV ({np.min(muap_data_uV):.2f} uV)")
    print(f"\tMax: {np.max(muap_data_mV):.6f} mV ({np.max(muap_data_uV):.2f} uV)")
    print(f"\tPeak-to-peak: {np.ptp(muap_data_mV):.6f} mV ({np.ptp(muap_data_uV):.2f} uV)")

    # Get grid dimensions from annotations
    n_rows, n_cols = muap_signal.annotations["grid_shape"]

    # Create subplot grid matching electrode layout
    fig, axs = plt.subplots(
        n_rows, n_cols, figsize=(n_cols * 2, n_rows * 2), sharex=True, sharey=True
    )
    fig.suptitle(f"MUAP {muap_index} ({np.ptp(muap_data_mV):.1f} mV peak-to-peak)")

    # get 100 ms around the center for better visualization (captures full MUAP waveform)
    time_vector = muap_signal.times.rescale(pq.ms).magnitude

    # Plot each electrode's waveform
    for row in range(n_rows):
        for col in range(n_cols):
            axs[row, col].plot(
                time_vector,
                muap_data_mV[:, row, col],
                linewidth=1.5,
            )
            axs[row, col].grid(False)
            if row == n_rows - 1 and col == n_cols // 2:
                axs[row, col].set_xticks([0, 7.5, 15])
                axs[row, col].set_xlabel("Time (ms)")
            if col == 0 and row == n_rows // 2:
                axs[row, col].set_ylabel("Amplitude (mV)")

    plt.tight_layout()
    plt.show()
Out:
MUAP 0 amplitude range:
        Min: -0.009340 mV (-9.34 uV)
        Max: 0.014180 mV (14.18 uV)
        Peak-to-peak: 0.023519 mV (23.52 uV)

MUAP 1 amplitude range:
        Min: -0.006783 mV (-6.78 uV)
        Max: 0.010293 mV (10.29 uV)
        Peak-to-peak: 0.017076 mV (17.08 uV)

MUAP 2 amplitude range:
        Min: -0.015327 mV (-15.33 uV)
        Max: 0.020130 mV (20.13 uV)
        Peak-to-peak: 0.035457 mV (35.46 uV)

MUAP 3 amplitude range:
        Min: -0.022737 mV (-22.74 uV)
        Max: 0.025489 mV (25.49 uV)
        Peak-to-peak: 0.048225 mV (48.23 uV)
Total running time of the script: ( 1 minutes 5.760 seconds)