Note
Go to the end to download the full example code.
Recruitment Thresholds#
The first step in using MyoGen is to generate the recruitment thresholds of the motor units (MUs).
Note
A recruitment threshold is the minimum force required to activate a MU.
In MyoGen, the threshold is defined between 0 and 1, where 0 is the minimum force required to activate a MU and 1 is the maximum force required to activate a MU.
MyoGen offers 4 different models to generate the recruitment thresholds:
Fuglevand model: Classic exponential distribution (Fuglevand et al., 1993)
De Luca model: Slope-corrected exponential distribution (De Luca & Contessa, 2012)
Konstantin model: Exponential with explicit maximum threshold control (Konstantin et al., 2019)
Combined model: Hybrid approach combining De Luca shape with Konstantin scaling (Ours)
Import Libraries#
from pathlib import Path

import joblib


from myogen import simulator
Define Parameters#
Each recruitment threshold simulation is defined by the following parameters:
N: Number of motor units in the poolrecruitment_range: Recruitment range (max_threshold / min_threshold)
Note
The recruitment_range is defined as the ratio between the maximum and minimum recruitment thresholds.
For example, if the recruitment_range is 50, the biggest MU will have a recruitment threshold 50 times bigger than the smallest MU.
With some models you also need to define additional parameters:
De Luca model:
deluca__slopes: Different slope values to demonstrate variety
Konstantin model:
konstantin__max_threshold: Maximum recruitment threshold
Combined model:
deluca__slopes: Different slope values to demonstrate varietykonstantin__max_threshold: Maximum recruitment threshold
n_motor_units = 100  # Number of motor units in the pool
recruitment_range = 50  # Recruitment range (max_threshold / min_threshold)

# Model specific parameters
fuglevand_params = {}  # No additional parameters needed

deluca_slopes = [0.001, 5, 25, 50]  # Different slope values to demonstrate variety

konstantin_max_threshold = 1.0  # Maximum recruitment threshold

combined_slopes = [0.001, 5, 25, 50]  # Slopes for combined model
combined_max_threshold = 1.0  # Maximum threshold for combined model
Generate Recruitment Thresholds#
Generating the recruitment thresholds is done by calling the generate_mu_recruitment_thresholds function.
Important
MyoGen is intended to be used with the following API:
from myogen import simulator
# load_nmodl_files()

# Create results directory
save_path = Path("./results")
save_path.mkdir(exist_ok=True)

# 1. Fuglevand Model
rt_fuglevand, rtz_fuglevand = simulator.generate_mu_recruitment_thresholds(
    N=n_motor_units, recruitment_range__ratio=recruitment_range, mode="fuglevand"
)

# 2. De Luca Model with different slopes
deluca_results = {}
for slope in deluca_slopes:
    rt, _ = simulator.generate_mu_recruitment_thresholds(
        N=n_motor_units,
        recruitment_range__ratio=recruitment_range,
        deluca__slope=slope,
        mode="deluca",
    )
    deluca_results[slope] = rt

# 3. Konstantin Model
rt_konstantin, rtz_konstantin = simulator.generate_mu_recruitment_thresholds(
    N=n_motor_units,
    recruitment_range__ratio=recruitment_range,
    konstantin__max_threshold__ratio=konstantin_max_threshold,
    mode="konstantin",
)

# 4. Combined Model with different slopes
combined_results = {}
for slope in combined_slopes:
    rt, _ = simulator.generate_mu_recruitment_thresholds(
        N=n_motor_units,
        recruitment_range__ratio=recruitment_range,
        deluca__slope=slope,
        konstantin__max_threshold__ratio=combined_max_threshold,
        mode="combined",
    )
    combined_results[slope] = rt
Save Recruitment Thresholds#
Note
All MyoGen objects can be saved to a file using joblib. This is useful to avoid re-running expensive simulations if you need to use the same parameters.
joblib.dump(combined_results[50], save_path / "thresholds.pkl")
['results/thresholds.pkl']
Plot Recruitment Thresholds#
The recruitment thresholds can be plotted using the plot_recruitment_thresholds function.
Note
Plotting helper functions are available in the myogen.utils.plotting module.
from myogen.utils.plotting import plot_recruitment_thresholds
# Suppress font warnings to keep output clean
import warnings
import logging

warnings.filterwarnings("ignore", message=".*Font family.*not found.*")
warnings.filterwarnings("ignore", message=".*findfont.*")
logging.getLogger("matplotlib.font_manager").setLevel(logging.ERROR)

from myogen.utils.plotting import plot_recruitment_thresholds
from matplotlib import pyplot as plt
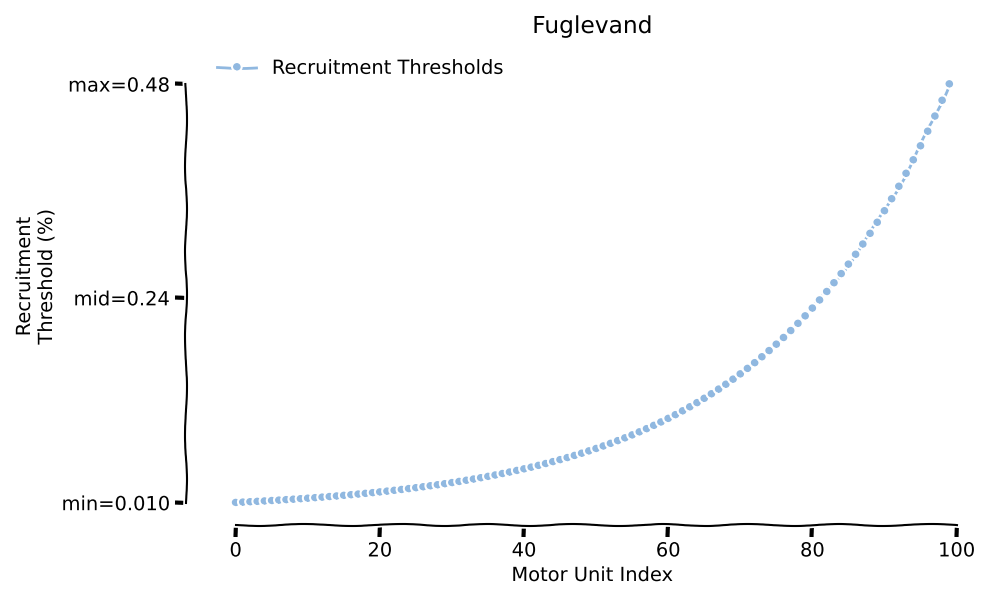
Fuglevand Model Visualization#
The Fuglevand model uses a simple exponential distribution for recruitment thresholds. This is the classic approach from Fuglevand et al. (1993).
print("Plotting Fuglevand model...")
with plt.xkcd():
    _, ax = plt.subplots(figsize=(10, 6))
    plot_recruitment_thresholds(
        rt_fuglevand, [ax], model_name="Fuglevand", colors="#90b8e0"
    )
plt.tight_layout()
plt.show()
Plotting Fuglevand model...
Creating Fuglevand model visualization...
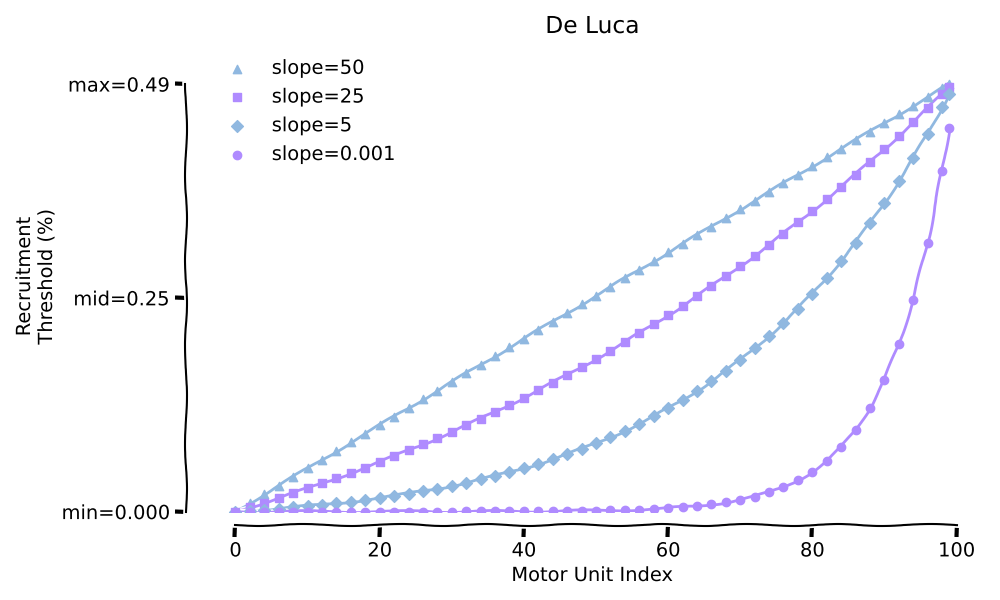
De Luca Model Visualization#
The De Luca model includes a slope correction parameter that allows control over the shape of the recruitment threshold distribution.
print("Plotting De Luca model...")
with plt.xkcd():
    _, ax = plt.subplots(figsize=(10, 6))
    plot_recruitment_thresholds(
        deluca_results,
        [ax],
        model_name="De Luca",
        colors=["#90b8e0", "#af8bff", "#90b8e0", "#af8bff"],
    )
plt.tight_layout()
plt.show()
Plotting De Luca model...
Creating De Luca model visualization...
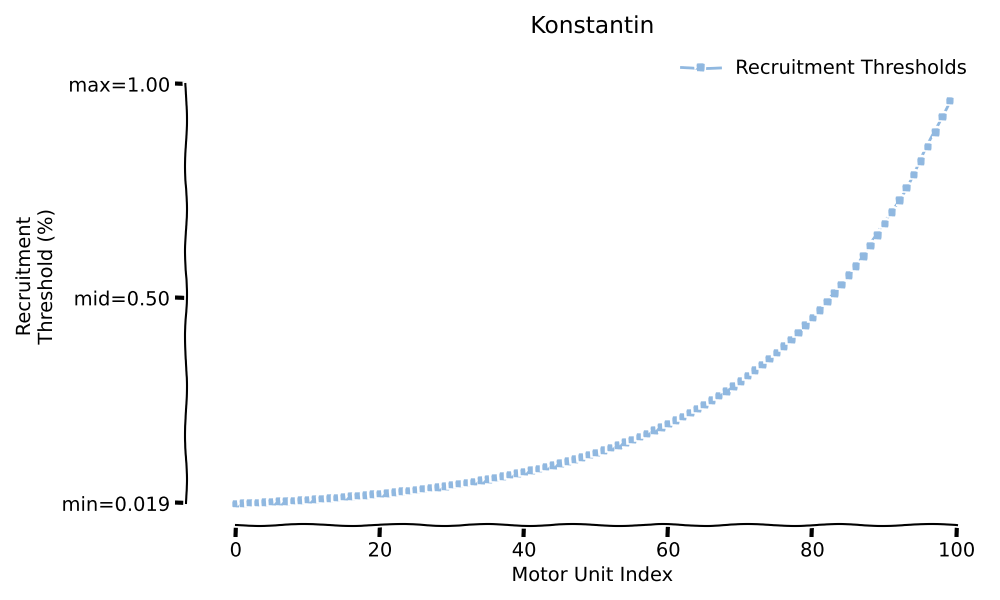
Konstantin Model Visualization#
The Konstantin model provides explicit control over the maximum recruitment threshold while maintaining physiological recruitment patterns.
print("Plotting Konstantin model...")
with plt.xkcd():
    _, ax = plt.subplots(figsize=(10, 6))
    plot_recruitment_thresholds(
        rt_konstantin,
        [ax],
        model_name="Konstantin",
        y_max=konstantin_max_threshold,
        colors="#90b8e0",
        markers="s",
    )
plt.tight_layout()
plt.show()
Plotting Konstantin model...
Creating Konstantin model visualization...
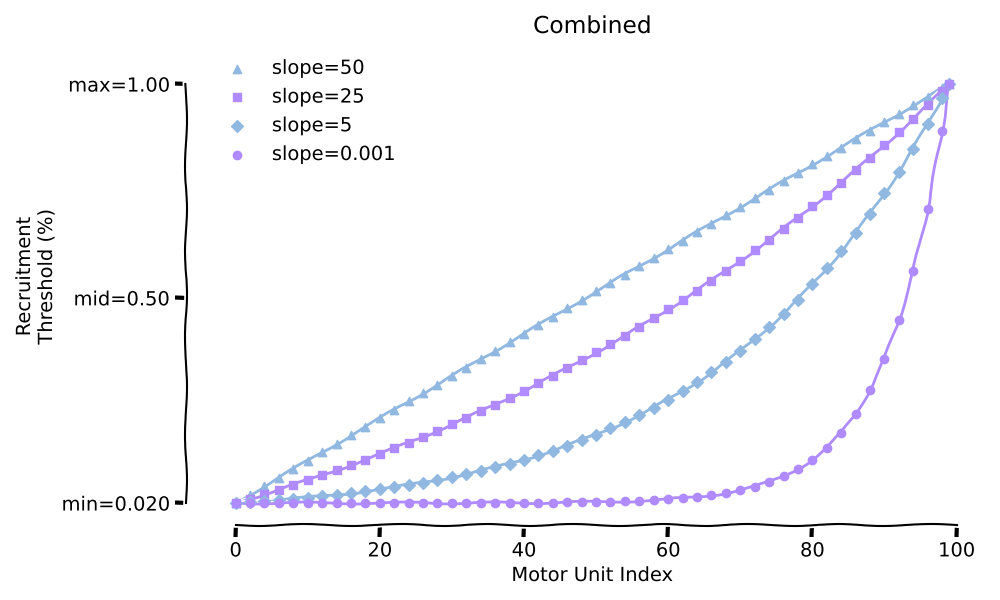
Combined Model Visualization#
The Combined model merges De Luca’s shape control with Konstantin’s scaling, offering the most flexibility for custom recruitment patterns.
print("Plotting Combined model...")
with plt.xkcd():
    _, ax = plt.subplots(figsize=(10, 6))
    plot_recruitment_thresholds(
        combined_results,
        [ax],
        model_name="Combined",
        y_max=combined_max_threshold,
        colors=["#90b8e0", "#af8bff", "#90b8e0", "#af8bff"],
    )
plt.tight_layout()
plt.show()
Plotting Combined model...
Creating Combined model visualization...
Total running time of the script: (0 minutes 0.592 seconds)